Claremont Global Fund Active ETF
| 31 May 2026 (AUD) | Since inception (p.a) | 10 years (p.a) | 7 years (p.a) | 5 years (p.a) | 3 years (p.a) | 1 year | 6 months | 3 months |
|---|---|---|---|---|---|---|---|---|
| Portfolio return (AUD, net of fees) | 10.2% | 9.0% | 7.6% | 3.8% | -0.8% | -21.0% | -17.2% | -4.9% |
| MSCI AC World Accum Index ex-Aust (AUD) | 12.8% | 13.0% | 13.9% | 13.2% | 18.2% | 16.8% | 3.3% | 6.7% |
| Excess return | -2.6% | -3.9% | -6.4% | -9.4% | -19.0% | -37.9% | -20.5% | -11.5% |
All numbers in AUD. Performance is net of investment management fees. Inception date is 18th February 2014. Numbers may not sum due to rounding. Since inception return is annualized and assumes reinvestment of distributions. Past performance should not be taken as an indication of future performance.
Claremont Global Fund Active ETF calendar year return (net) vs benchmark
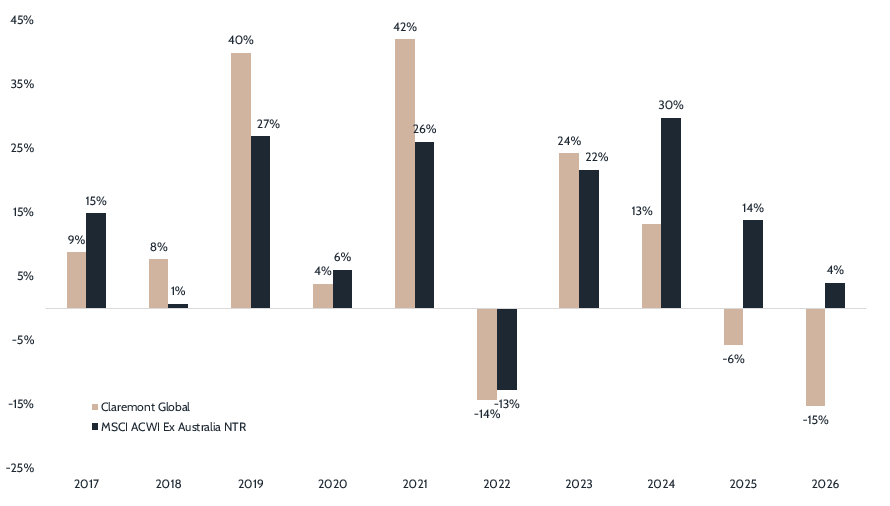
All numbers in AUD. Calendar year-to-date (CYTD) performance for 2026 reflects data up to 31 May 2026. Performance is net of investment management fees. Past performance should not be taken as an indication of future performance.
Claremont Global Fund (Hedged) Active ETF
| 31 May 2026 (AUD) | Since inception (p.a) | 10 years (p.a) | 7 years (p.a) | 5 years (p.a) | 3 years (p.a) | 1 year | 6 months | 3 months |
|---|---|---|---|---|---|---|---|---|
| Portfolio return (AUD, net of fees) | 8.6% | 8.2% | 6.5% | 1.0% | 1.7% | -11.7% | -8.8% | -3.4% |
| MSCI AC World Accum Index ex-Aust (AUD, hedged) | 11.3% | 12.4% | 13.5% | 11.4% | 21.4% | 30.3% | 12.7% | 7.7% |
| Excess return | -2.7% | -4.2% | -7.0% | -10.4% | -19.6% | -42.0% | -21.5% | -11.1% |
All numbers in AUD. Performance is net of investment management fees. Inception date is 18th February 2014. Numbers may not sum due to rounding. Since inception return is annualized and assumes reinvestment of distributions. Past performance should not be taken as an indication of future performance.